
Analysing NOSACQ-50 data
Here you can find out how to score the items in NOSACQ-50.
How to score the items in NOSACQ-50
Option 1
Use the Excel file found under the section regarding submitting your data.
Option 2
Calculate the results yourself by following the procedures below, as well as using statistical programs like SAS, SPSS or STATA
The questionnaire is organized in 7 dimensions with between 6-9 items each. The items can be divided into two groups – those asked in a positive way and those items asked in a reversed (negated) way.
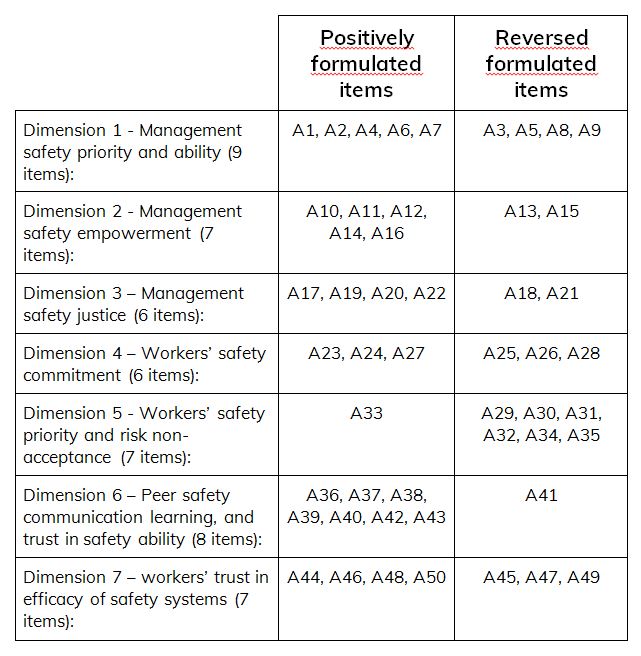
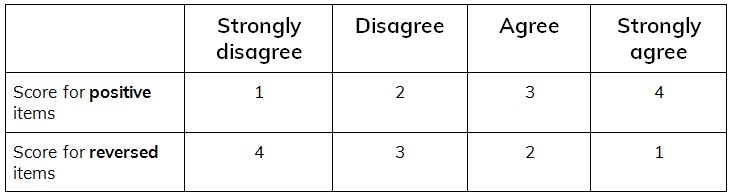
All the items in the questionnaire are answered in the same way (Lichert scale 1-4), but have to be scored dependent of the formulation of the question:
In order to calculate the mean score for a single dimension the easiest way is to enter the observed values into a spreadsheet like Excel and then subsequently calculate the true means.
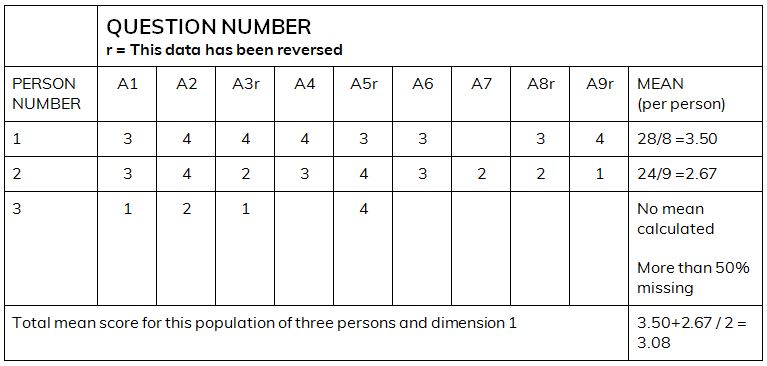
For dimension 1 the true mean for one person will be:
(A1+A2+(5-A3)+A4+(5-A5)+A6+A7+(5-A8)+(5-A9)) / Number of answered items
Only answered items will be entered into the calculation. If a person has answered all 9 items the denominator ‘Number of answered items’ for dimension 1 will be 9. If a person has only answered 7 items the denominator ‘Number of answered items’ will be 7. (See example below).
However, if a person has answered less than 50% of the items in a dimension, all his / her answers in that dimension should be ignored and not be included in the total mean. (See example below).
When all the participants' data have been entered into the spreadsheet and their means for the dimensions have been calculated, a total mean for the population has to be calculated for each of the 7 dimensions as a 'mean of the mean'.
Example – how to calculate the 'mean of the mean' for dimension 1:
5 persons have the following scores on dimension 1: 2.67; 2.33; 2.44; 2.56; 2.67
The total mean for that population will then be (2.67+2.33+2.44+2.56+2.67)/5 = 2.53
DIMENSION 1 – EXAMPLE

Proceed with same procedure for each of the remaining dimensions.
When calculating the means for each person you can use the following calculations:
Dimension 1: (A1+A2+(5-A3)+A4+(5-A5)+A6+A7+(5-A8)+(5-A9)) / Number of answered items
Dimension 2: (A10+A11+A12+(5-A13)+A14+(5-A15)+A16) / Number of answered items
Dimension 3: (A17+(5-A18)+A19+A20+(5-A21)+A22) / Number of answered items
Dimension 4: (A23+A24+(5-A25)+(5-A26)+A27+(5-A28)) / Number of answered items
Dimension 5: ((5-A29)+ (5-A30)+ (5-A31)+ (5-A32)+A33+(5-A34)+ (5-A35)) / Number of answered items
Dimension 6: (A36+A37+A38+A39+A40+(5-A41)+A42+A43) / Number of answered items
Dimension 7: (A44+(5-A45)+A46+(5-A47)+A48+(5-A49)+A50) / Number of answered items
Reliability
Testing the reliability of the results within a scale should be done separately for the worker and leader responses. We have used Cronbach's Alpha as an indicator for the reliability of the results. A Cronbach's Alpha below 0.67 is considered poor; 0.67 - 0.8 is considered acceptable; and above 0.8 is good.
In SPSS you can run the test under: Analyze - Scale - Reliability analysis
RELIABILITY
/VARIABLES=a1 a2 a3 a4 a5 a6 a7 a8 a9
/SCALE('Dim 1 - Management safety priority and ability') ALL
/MODEL=ALPHA
/SUMMARY=MEANS
/SUMMARY=TOTAL.
RELIABILITY
/VARIABLES=a10 a11 a12 a13 a14 a15 a16
/SCALE('Dim2 - Management safety empowerment') ALL
/MODEL=ALPHA
/SUMMARY=MEANS
/SUMMARY=TOTAL.
Etc. etc. for each dimension.